Complete the third level of the Loop Game.
Challenge
Complete the fourth level of the Loop Game.
The mathematical constant π is an irrational number that represents the ratio between a circle's diameter and its circumference. The first algorithm designed to approximate π was developed by Archimedes in 250 BC, and was able to approximate its value within 3 significant figures. Today we know that there are an infinite number of digits in π, so lets use a little more sophisticated approach to estimate its value.
Details
Create the program in a file called leibniz.py. This function asks the user to input an integer, which is the number of terms to compute in the infinite series. It should use this value to compute the Leibniz approximation, discussed below.
The Leibniz approximation relies on the fact that:
$$ \frac{\pi}{4} = \frac{1}{1} - \frac{1}{3} + \frac{1}{5} - \frac{1}{7} - \ldots $$
Which can be rewritten to approximate the true value of π:
$$ \pi = \frac{4}{1} - \frac{4}{3} + \frac{4}{5} - \frac{4}{7} - \ldots $$
Make sure to test your program by running it multiple times with different inputs. Make sure your code follows the course's code conventions.
Example
  $python3 leibniz.py
  How many terms? 1000
  3.140592653839794
Hint
- You will need a for loop that uses the accumulator pattern to accomplish this goal. Create a variable (defaulted value to 0) before the for loop. Then you just need to update the value of the variable inside the for loop.
- As you progress through your for loop, the denominator of your fraction increases by a factor of two. Some simple algebra will reveal that during loop iteration i, the denominator is: $$(2 \times i) + 1$$
- You need to alternate adding and subtracting. However, subtracting is the same as adding a negative number. So we can accomplish this by multiplying every other fraction by -1. The easy way to do this is to compute: $$-1^{i}$$ Where \(i\) is your loop variable.
- The accumulator be the sum of all of the terms in the sequence, so you only need to add one term to the accumulator during each loop iteration.
Challenge
The value you get from the Leibniz formula will be incredibly
close. However, it will never meet the true definition of π.
To see how close it does get, compute the approximations
for all equations from length 1 to length
1000. For each approximation, subtract the value
of math.pi from it to compute the error. Sum up all
of these errors, and print the average error.
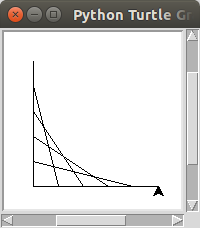
Computer displays are made up of a grid of tiny lights. Because the displays are not continuous, curved objects must be broken into many non-continuous pieces. So curves are often simply represented as many straight lines. In this activity you will approximate a curve by drawing many lines.
Details
In Emacs, create a Python program in a file called curve.py. Your program should use the turtle module to draw a curve using overlapping straight lines between the x-axis and the y-axis.
Do not hard code the location of the line segment end points. Your program should have a variable that determines the size of the drawing. Your program should calculate the end point locations based on the size variable. Make sure you use proper variable names and follow the courses code conventions.
Example
$ python3 curve.py
Hint
- You want to use the new range values for this activity. You need to determine how much space to be between consecutive points on the lines. This will be the step amount for your loop.
- Drawing the curve is much easier if you use the
function
turtle.goto. - For each line, calculate the coordinates of both end points
- Use the
turtle.gotofunction to move the turtle to the start point, then use theturtle.gotofunction again to move the turtle to the end point. - Note that you may need to use the
turtle.upandturtle.downfunctions to prevent the turtle from drawing a line when it moves to the line's start end point.
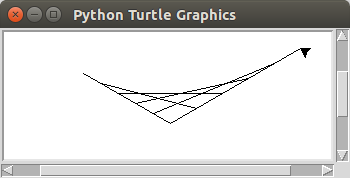
Challenge
This same technique can be used to draw a myriad of different curves, by changing the length and angle of the axes. Add variable to your program that specify the length and angle of each of the axes to create curves like the following.
Submission
Please show your source code and run your programs for the instructor or lab assistant. Only a programs that have perfect style and flawless functionality will be accepted as complete.