- Location
- Trexler 363
- Times
- MWF 3:30 - 5:30
- Office Hours
- M-Th 6 - 7pm
- Office
- Trexler 365B
- chssmith AT roanoke DOT edu
Mandelbrot
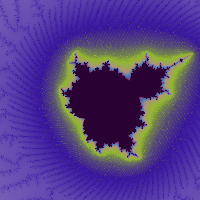
The Mandelbrot set is a set of complex numbers that remains bounded (does not increase to infinity) when iterated with a quadratic polynomial function. When the set is graphed on the complex plane, the set boundary has a complex pattern that does not simplify at any magnification and is therefore defined as a fractal.
Setup
Create a directory assignment6 under assignments in your cs170 directory. All code for the assignment should be stored in this directory.
cd ~/cs170/assignments
mkdir assignment6
cd assignment6
Details
The first part of this assignment is the creation of a class that represents . Complex numbers are of the form (a+bi), where i is the mathematical imaginary number. For Mandelbrot, you will be required to have three operations: addition, multiplication, and magnitude (euclidean distance from the origin for the complex number). We will discuss in class how you can add, multiply, and compute the magnitudes.
Create a program that draws an image of the Mandelbrot set for complex numbers in the range \(-2 < a, b < 2\). To draw the set using Tk, you will need to convert canvas pixel x, y coordinates to complex a, b coordinates. For example, if the canvas is 200 by 200 pixels, the pixel (0, 0) would map to the complex coordinate (-2, -2) and the pixel (100, 100) to the complex coordinate (0, 0). For each pixel in the image set the color to a shade of gray depending on how many iterations of the quadratic polynomial function were required for the complex number's magnitude (absolute value) to exceed 2. The quadratic polynomial function can be defined recursively as:
\[ c_n = c_{n-1}^2 + c_0 \]Where \(c_0\) is an initial complex number, that corresponds to a pixel in the image, and \(c_n\) is the nth complex number computed with the quadratic polynomial function. Note, since 255 is the largest number that can be represented with a gray-scale color, 255 is the maximum number of times that you need to iterate the quadratic polynomial function. For example, if the quadratic polynomial function is iterated 100 times before the absolute value becomes larger than 2, then set the pixel to be the color with the RGB values (100, 100, 100).
The real beauty of the Mandelbrot set is not the full image, but the
inherent recursive structure that becomes apparent as you zoom in on
pieces of the set. For this, you will want to write your functions
that compute the set in such a way that the user can specify what
locations to "zoom" in on within the image. To this end, your
program should store 3 global
variables: CENTER_X, CENTER_Y,
and COMPLEX_WIDTH. If you set these variables to 0, 0,
and 4 respectively, you will generate the whole mandelbrot set.
Zooming in should just require changing these 3 values.
In order to implement this, the program should store the range of complex numbers that are currently being rendered in class attributes. The program should also have a method that converts pixel coordinates to complex coordinates using the current complex range instance variables. The following equations will convert between pixels coordinates and complex complex coordinates in a specified range:
\[ \begin{eqnarray} c_a &=& \frac{p_x}{W} \times (max\_a - min\_a) + min\_a\\ c_b &=& \frac{p_y}{H} \times (max\_b - min\_b) + min\_b \end{eqnarray} \]Where c is the complex coordinate that corresponds to the pixel coordinate, p, W and H are the width and height of the window, and min and max are the current complex range of values.
Make sure you play around with different generations of the Mandelbrot set. Include a screenshot of your favorite image with your code submission. Make it a good one, because the best image in the class (as selected by an on-line poll) will be hung on my office door, and displayed on the course website. For the purposes of the competition, you should generate large images, on the order of 1000 x 1000 pixels. Please note that generating a 1000 x 1000 pixel image of the mandelbrot set will take a considerable amount of time (a generation of 1000 x 1000 can take up to 20 minutes in a semi-optimal case), even with the alternative solutions to some of the above problems. Allow plenty of time to generate your favorite images!
Pseudocode
For Monday, Feb. 29th, you are required to provide pseudocode for
the ENTIRE assignment. You are required to have at
least one class: ComplexNumber. For this class, you
should provide the class invariant, the definition of the
constructor, the definition for any methods you believe you will
need for this class, and Pre/Post conditions for these methods.
You should also pseudocode the "main" driver program, and create a list of functions you need for this driver program to run. For any function you need to define, make sure you list the Pre and Post conditions!
Submission
You are required to submit a tar file to http://inquire.roanoke.edu/. On inquire, there is a link for Assignment 6. You can create a tar file by issuing the following commands:
cd ~/cs170/assignments
tar czvf assignment6.tgz assignment6/
"Hacker" Prompt
-
Color Map: It is possible to create more visually pleasing images by using a color map to specify what color maps to which escape value. It is possible, for example, to have a color map between colors with RGB values \((100, 255, 150)\) and \((200, 50, 0)\) by interpolating between the two colors based on the escape value. It is possible to interpolate by using the linear interpolation equation we used in bezier, but use it with each of the color channels. For example, if the escape value is 128, then the interpolated color of the above two colors would be:
\[ \begin{eqnarray} r &=& (100 \times (1 - i)) + (200 \times i)\\ g &=& (255 \times (1 - i)) + (50 \times i)\\ b &=& (150 \times (1 - i)) + (0 \times i) \end{eqnarray} \]where \(i = \frac{128}{255}\), which results in the following values:
\[ \begin{eqnarray} r &=& (100 \times (1 - 0.50196) + (200 \times 0.50196)) = 150.196\\ g &=& (255 \times (1 - 0.50196) + (50 \times 0.50196)) = 152.0982\\ b &=& (150 \times (1 - 0.50196) + (0 \times 0.50196)) = 74.706 \end{eqnarray} \]It is also possible to produce a color map with more than two colors by first determining which pair of colors an escape value is between, and then interpolating the colors. For example, if a color map consists of three colors and the escape value is 42, then because \(\frac{42}{255}\) is less than 0.5 the interpolated color would be produced by interpolating between the first and second colors with \(i = \frac{42}{127}\).
-
Click, Click, Zoom: As you will no doubt be able to see, trying to find interesting locations in the Mandelbrot set with the above zoom capabilities is going to be difficult. You will have to manually convert from image pixels to complex numbers, and determine the zoom factor the same way.
However, there is an easier way. But it involves click handlers. Define a click handler that can get the location the user wishes to zoom in. You can also assume that each click will zoom in by a factor of 2. For the first click, the size of the complex plane becomes 2, ranging from (-1, 1) in both directions. You could also add a click handler for right clicks, which will zoom out, doubling the size of the square being generated.
This process will be faster than manually determining where to zoom, but is still is not going to be quick. Be prepared to wait several seconds (or minutes) between each click to see the new zoomed in location. The code for this, however, is pretty easy to implement.
-
Saving: If you do the above click handler, you might want to be able to save the location that you just generated. It will make getting back to that location much easier. You could also add some code that would automatically generate an image for you, instead of having to take a screenshot!
Look at the documentation for the
Menuwidget of Tk. Add two options on this menu: Save coordinates and save image. Save coordinates should save the current coordinates to a file that your program has specified. Save image should save the image currently on the canvas to a file you have specified in your program. For this, you will need access to an additional module for writing an image, which can be made available upon request. Note: The way this is defined, you can very easily overwrite previously generated information. Be careful!