Lecture 15 - Analysis and Timing of Algorithms
As usual, create a directory to hold today's activities:
$ mkdir ~/cs170/labs/lab15
$ cd ~/cs170/labs/lab15
Comparing Algorithms and Validation
I blew some minds Monday with the analysis of the two searches we did last week. Today, I want to go a little bit deeper with out analysis.
However, it's not only a good idea to analyze our algorithms, but also our implementation of our algorithms. If we know our algorithm runs in O(n), we better make sure our algorithm runs in essentially that same amount of time. That is your job for today's lab.
We have the that says binary search should be quicker than linear search, at least in the worst case when the list sizes are arbitrarily large. But it would be nice to have validation for that. Let's use some of Python's built in mechanisms to time our searching algorithms, and just verify that our math is indeed correct.
Details
Create a file called timed_searching.py, which will time
your actual execution times for both linear_search
and binary_search. You will want to copy
your searching.py file from the last lab into your current
directory, to make your life a lot easier:
$ cd ~/cs170/labs/lab15
$ cp ../lab13/searching.py .
Python provides a built in library for timing your code, called
timeit.
This module includes a class called Timer, which can be
used to create an object for timing a given function. You can use
the code from the lecture, but you will have to make a few key
changes to make sure the timings are fair.
Since your search functions were written generically enough, you can
easily search lists of integers as well as Strings. To create a
sorted list of integers, you can use the range function.
>>> my_list = list(range(10))
>>> print(my_list)
[0, 1, 2, 3, 4, 5, 6, 7, 8, 9]
For fairness, create a class called Timing, which will
have an attribute for the list being searched. You should have
methods called test_linear and test_binary,
which simply call your search algorithms on the list stored in the
attribute.
Once you have your class created, You then just need to create a timer object that will call your testing methods. Your method should return a tuple of floating point values, the times for both linear and binary search respectively.
Time your two search functions on list sizes from 100 to 1000,
incrementing by 50 each time.
Make sure you are executing the worst case for searching, so that
you are estimating the Big-oh class of each of the functions. For
the sake of consistency, you will want the timer to execute at least
1000 times per trial. You can specify this when you call the
timeit method of the Timer object.
Example
>>> timing_object = Timing(list(range(100)))
>>> linear_time, binary_time = timing_object.time_search()
>>> print("Linear:", linear_time, "Binary:", binary_time)
Linear: #.###### Binary: #.######
Challenge
You all had questions about whether it would be more efficient to
use the in syntax to determine whether an item was in
the list. While it's not necessarily the point of the activity,
let's see how the in syntax compares to linear and
binary search.
Modify your code above to also test in against
everything else. How do the times compare against your other search
algorithms? Write a sentence or two (in the comments of this file)
describing your findings.
Now you have seen how we can use math to determine the computational complexity (using Big-Oh) of an algorithm. You've also seen how we can time algorithm implementations, to get some data on actual run times of the worst case. How closely do these compare? The easiest way to compare these two will be visually: plot the timing data, and see what the graphs actually look like!
Details
Add a class Plot to your timed_searching.py
file. This class should take a list of floats (timing data) and
plot them using tkinter. For visual sakes, we will treat the
lower-left hand corner of the tk window as the origin [(0, 0)], with
x increasing to the right and y increasing up. Note that this is
different than the way the window is actually set up for the y direction.
Get timing data for both binary_search and
linear_search. Plot this timing data on the tk window
using your Plot class. You will probably notice that
you get essentially a straight line for both, at the very bottom of
the screen. This is because the timing data is incredibly small.
You should scale the data so the maximum time across both algorithms
appears at the top of the window, and everything else appears in the
correct proportional location relative to this shift. You should
also scale the x axis as well, to make sure all of your data
points appear in the window.
Example
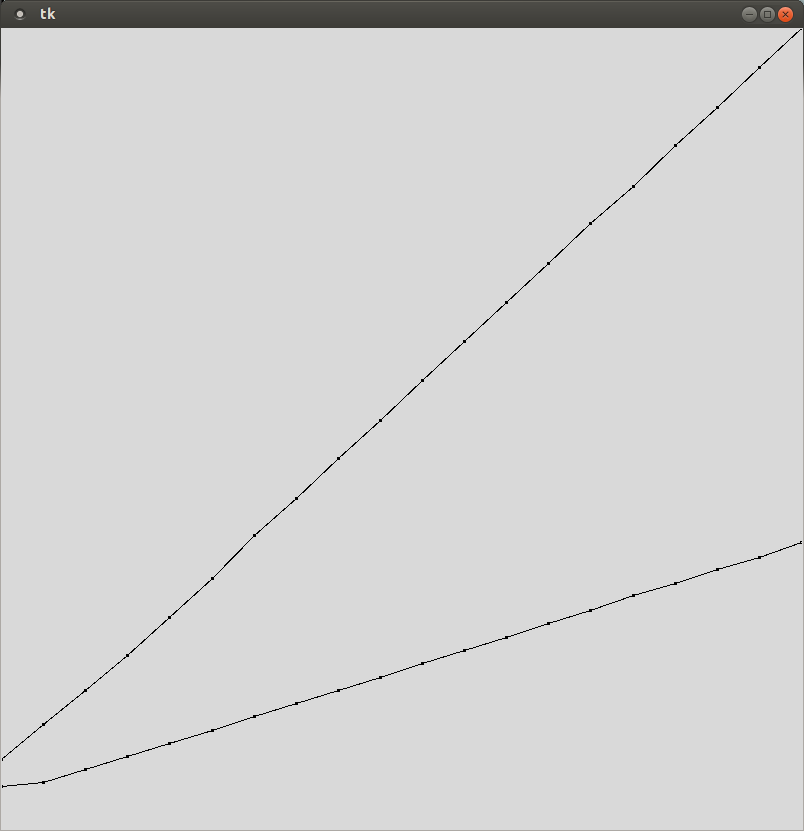
This is not a plot for linear vs. binary search. It is simply an example of what a plot should look like.
Hint
If you know the maximum value for a given dimension, you can determine the scaling factor by computing the ratio of the window size versus that maximum value.
Your
Plotclass should have an attribute that stores the list of data points to plot on the window. As a matter of fact, you might want to have a list of lists, so that you can plot an arbitrary number of data sets to the window.-
Remember, you can use the
create_linemethod of the canvas to draw an arbitrary line between two points. Your plot is just going to be a series of lines that connect the appropriate data points.You may need to store the previous x and y coordinates to ease the burden of using the create_line method. You can always assume that your plots will start at our personal (0, 0), which is our lower-left hand corner of the window.
Challenge
Change the colors of the lines you are plotting, so that it is easier to differentiate between the two search methods.
Challenge
Now you have a class that can time code, and a class that can
plot that timing data. Use these classes to plot
insertion_sort versus selection_sort. If
you are feeling adventurous, try plotting the built in
.sort method of lists as well.
Submission
When you have finished, create a tar file of your lab15
directory. To create a tar file, execute the following commands:
cd ~/cs170/labs
tar czvf lab15.tgz lab15/
To submit your activity, go to cseval.roanoke.edu. You should
see an available assignment called Lab Assignment 15.
Make sure you include a header listing the authors of the file.
In-Class Notes
timing_sample.pyLast modified: Wed Feb 19 14:00:55 EST 2014