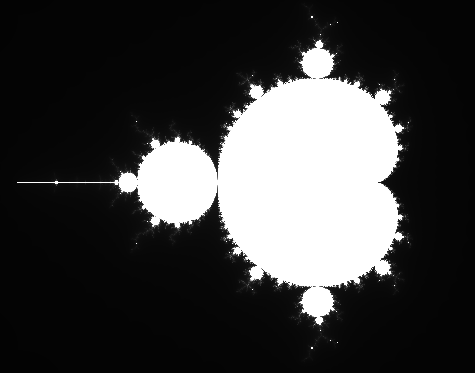
The Mandelbrot set is a set of complex numbers that remains bounded (does not increase to infinity) when iterated with a quadratic polynomial function. When the set is graphed on the complex plane, the set boundary has a complex pattern that does not simplify at any magnification and is therefore sometimes defined as a fractal.
Create a program that plots the Mandelbrot set for complex
numbers in the range -2 > a, b < 2. To do this you will
need to convert pixel x, y coordinates to complex a, b
coordinates. For example, if the window is 200 by 200 pixels, the
pixel (0, 0) would map to the complex coordinate (-2, -2) and the
pixel (100, 100) to the complex coordinate (0, 0). If the complex
number that cooresponds to a pixel is in the Mandelbrot set, draw
the pixel as white, if it is not, draw it as a shade of gray
depending on how many iterations of the quadratic polynomial
function were required to determine that it is not in the set.
Note, this is exactly what the quadPolyBound method
from the sub assignment computes. For example, if the quadratic
polynomial function is iterated 100 times before the absolute
value becomes larger than 2, then draw the pixel with the RGB
values (100, 100, 100).
For each pixel in the window you will need to determine the
color of the pixel and draw draw it. However, the Graphics class
does not contain a drawPixel
or drawPoint method. So instead, you will need to
create a BufferedImage that is the size of the window, set a
pixel's color using the setRGB method of the
BufferedImage class, and draw the image to the window. Note,
the setRGB method takes a single int parameter that
represents all three RGB values to set. To calculate this value,
create a Color object, specifying the red, green, and blue values
via the constructor, and use the getRGB method of the
Color class to convert the color to a single int.
When the user clicks on the image of the Mandelbrot set the program should zoom in on the click location by changing the range of the complex numbers. For exammple, if the window is 200 by 200 pixels, the inital complex range should be from (-2, -2) to (2, 2). If the complex range is halved on user clicks, a click on the pixel (100, 100), which is the complex coordinate (150, 50), would set the complex range to be from (0, -2) to (2, 0). In order to implement this, the program should store the range of complex numbers that are currently being render in instance variables. The program should also have a method that converts pixel coordinates to complex coordinates using the current complex range instance variables. The following equations will convert between pixels coordinates and complex complex coordinates in a specified range:
ca = W / px * (maxa - mina) + mina
cb = H / py * (maxb - minb) + minb
Where c is the complex coordinate that cooresponds to the pixel coordinate, p, W and H are the width and height of the window, and min and max are the current complex range of values. Note, be sure your program does not perform integer division when implementing the above equations.
Lastly, add the ability to save the currently displayed image to a high-resolution file. Based on some user input (a key press, button press, menu selection, or modified mouse click) create a buffered image that is 2000 x 1600 pixels and render the portion of the Mandelbrot set that is currently being drawn to the window, to the large image. Note, creating an image of the Mandelbrot set this large may take a little while, so you might want to test it on a smaller image first. Lastly, the large image should be saved to a file. Include your favorite image with your code submission. Make it a good one, the best image in the class (as selected by an on-line poll) will be framed and hung in Trexler.
Submission: Submit your code as a zip file with your name as the zip file name on the course Inquire site.
Color Map
It is possible to create more visually pleasing images by using a color map to specify what color maps to which escape value. It is possible, for example, to have a color map between colors with RGB values (100, 255, 150) and (200, 50, 0) by interpolating between the two colors based on the escape value. It is possible to interpolate by using the equation from lab, but use it with each of the color channels. For example, if the escape value is 128, then the interpolated color of the above two colors would be r = (100 * (1 - i)) + (200 * i), g = (255 * (1 - i)) + (50 * i), b = (150 * (1 - i)) + (0 * i), where i = 128 / 255.
It is also possible to produce a color map with more than two colors by first determining which pair of colors an escape value is between, and then interpolating the colors. For example, if a color map consists of three colors and the escape value is 42, then because 42 / 255 is less than 0.5 the interpolated color would be produced by interpolating between the first and second colors with i = 42 / 127.
Julia Set
Julia sets are sets of complex numbers that are related to the Mandelbrot set and are also capable of producing interesting images. A complex number is determined to be in a Julia set in a similar fashion as for the Mandelbrot set. The difference is that the quadratic polynomial equation for a Julia set is:
cn = cn-12 + cj
Where cj is any complex number. The more interesting Julia sets correspond to complex numbers that are near the boundary of the Mandelbrot set. Some interesting values for cj you could try are 0.4+0.6i, 0.285+0.01i, and -0.835-0.2321i
Smooth Gradient
The colors of the fractal correspond to the distance that a particular point is from the boundary of the set. The colors produce bands of distinct regions because the distance is calculated using integers. In order to find distances that can be fractional, and therefore produce images with smooth gradient transitions, use the following equation to determine the distance, and therefore the color, of a complex number:
c = n + 1 - ln(ln(|cn|) / ln(2)) / ln(2)
where n is the number of iterations of the quadratic polynomial function that were computed, cn is the complex number that was computed from the nth iteration, and ln is the natural log. The natural log is loge, which is what the Math.log(double) function computes. Note that the value that this equation computes is no longer in the range of 0 to 255. In order to use it to generate a color for the image you will have to find its minimum and maximum values and scale it back into the color range.