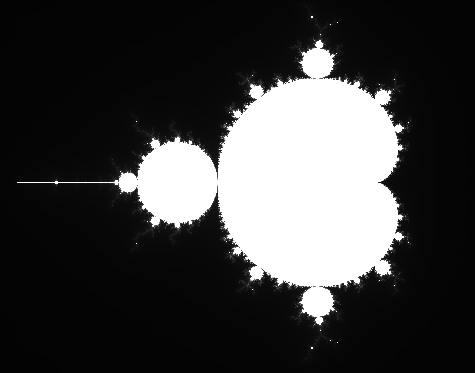
The Mandelbrot set is a set of complex numbers that remains bounded (does not increase to infinity) when iterated with a quadratic polynomial function. When the set is graphed on the complex plane the set boundary has a complex pattern that does not simplify at any magnification and is therefore sometimes defined as a fractal. Images of the Mandelbrot set boundary are common due to the simplicity of their creation and their beauty.
The quadratic polynomial function can be defined recursively as:
cn+1 = cn2 + c0
where ci is a complex number. Recall that a complex number is a number that can be written with the form a + bi, where a and b are real values and i is √-1.
In order to determine whether a complex number remains bounded could potentially take an infinite amount of time. Instead we can just estimate whether a number is bounded by testing if it is bounded by a small number in a small number of iterations. For this assignment assume that if the absolute value of ci is greater than 2 then c0 is not in the Mandelbrot set. If no ci, where 0 > i ≤ 255, is not in the Mandelbrot set (because of the above assumption), then assume that c0 is.
In order to calculate whether some c0 is in the Mandelbrot set you should create a class that represents complex numbers. It will need instance variables for the real and complex parts of a number, as well as methods for addition, multiplication, and absolute value. Two complex numbers are multiplied using the equation:
(a + bi)(c + di) = (ac - bd) + (bc + ad)i
Two complex numbers are added using the equation:
(a + bi) + (c + di) = (a + c) + (b + d)i
The absolute value of a complex number is computed using:
|a + bi| = √(a2+b2)
Create a program that plots the Mandelbrot set for complex numbers with -2 > a, b < 2. To do this create a method or constructor in the complex number class that can convert the coordinates of a pixel in the window to a complex number in the specified range. For example if the window is 200 by 200 pixels the pixel (0, 0) would map to the complex coordinate (-2, -2) and the pixel (100, 100) to the complex coordinate (0, 0). Also create a method in the complex number class that returns the number of iterations of the quadratic polynomial function that are required to determine if a complex number is in the Mandelbrot set. If the complex number is in the Mandelbrot set draw the pixel as white, if it is not draw it as a shade of gray depending on how many iterations of the quadratic polynomial function were required to determine that it is not in the set. That is, if ai or bi is greater than 100, then draw the pixel with the RGB values (i, i, i). (You can also map this to a color using the Color constructor that takes one integer to specify the RGB values, but the value will have to be scaled.) Each pixel can be drawn by using the fillRect method with a rectangle that is 1 by 1 pixel.
When the user clicks on the image have the image zoom in on the click location by changing the range of the complex numbers. For example if the window is 200 by 200 and the complex range is halved on user clicks, a click on the pixel (100, 100) would set the complex range to -1 > a, b < 1. A click on the pixel (50, 50) would set the complex range to -2 > a, b < 0.
Lastly zoom in on a portion of the image that creates an image that you like. Take a screen shot of the window and include it with your code submission.
Hand In: Tar and email your code to your instructor with a subject of cpsc170 postlab8.
The colors of the fractal correspond to the distance that a particular point is from the boundary of the Mandelbrot set. The colors produce bands of distinct regions because the distance is calculated using integers. In order to find distances that can be fractional, and therefore produce images with smooth gradient transitions, use the following equation to determine the distance, and therefore the color, of a complex number:
c = n+1-ln(ln(|cn|)/ln(2))/ln(2)
where n is the number of iterations of the quadratic polynomial function that were computed, cn is the complex number that was computed from the nth iteration, and ln is the natural log. The natural log is loge, which is what the Math.log(double) function computes. Note that the value that this equation computes is no longer in the range of 0 to 255. In order to use it to generate a color for the image you will have to find its minimum and maximum values and scale it back into the color range.