Curve
Computer displays are made up of a grid of tiny lights. Because the displays are not continuous, curved objects must be broken into many non-continuous pieces. So curves are often simply represented as many straight lines. In this activity, we will approximate a curve by drawing many lines.
Details
Create a Python program that uses the turtle module to draw a curve using overlapping straight lines between the x-axis and the y-axis. The program should prompt the user to enter the number of lines to draw and the axes’ length.
Example
Enter the number of lines:
5
Enter the length of the axes:
100
Enter the number of lines:
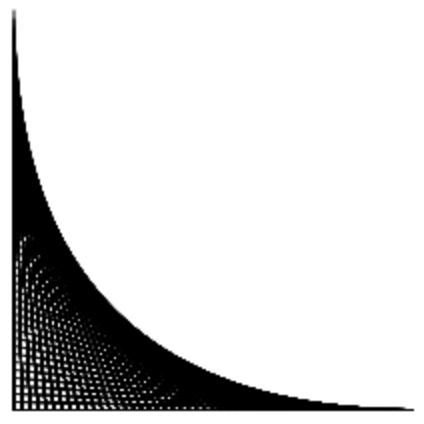
50
Enter the length of the axes:
200
Hint
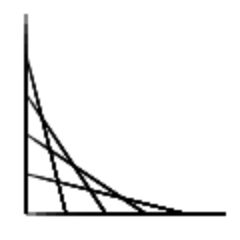
It’s helpful to see an illustration of the curve with actual numbers for the input. A curve with an axis length of 100 and 5 lines would look like:

Drawing the curve is much easier if you use the function
turtle.setposition.Use a loop to repeatedly draw the lines.
For each line, calculate the coordinates of the endpoints using the loop variable.
Determine how much space is between consecutive points on the axes by dividing the axis length by the number of lines.
Use the
turtle.setpositionfunction to move the turtle to the start point, then use theturtle.setpositionfunction again to move the turtle to the endpoint.You will need to use the
turtle.penupandturtle.pendownfunctions to prevent the turtle from drawing a line when it moves to the line's start endpoint.
Challenge
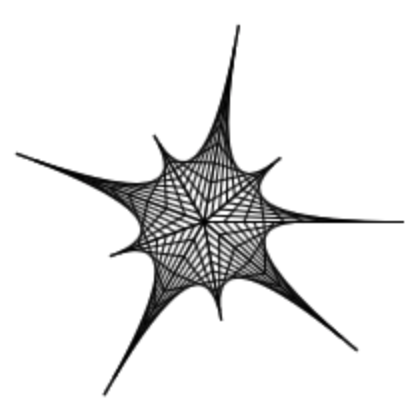
This same technique can draw a myriad of different curves by changing the axes’ length and angle. Add prompts fore the length and angle of both axes to create curves like the following.
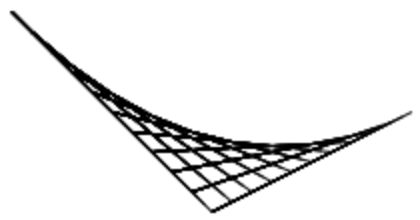
You can even put the code that draws the curve in a loop to draw multiple curves.