Bounce
Video players often included a screen saver, which is a logo that continually bounces around the screen. We can recreate this screen saver using the graphics module and conditional statements.
Details
Create a Python program that animates a ball bouncing around the screen. The ball should begin in the center of the screen and should move diagonally. Once it the reaches and edge of the screen, the ball should "bounce".
Example
Hint
The program should have a loop where each iteration the ball is drawn at a different location. Do not forget the
graphics.clear,graphics.update, andgraphics.waitfunctions.Create variables to represent the ball's x and y coordinates. The variables should be defined before the animation loop.
In addition to position, you need to store a variable for the ball's x and y velocity.
Use the accumulator pattern to update the ball's x location by the ball's velocity. The new position is the old position plus the velocity.
Use a conditional statement comparing the ball's x or y coordinates to the screen’s dimensions to determine if the ball has 'hit' the edge of the screen. The ball 'hit' the left edge of the screen if its x coordinate fell below the x coordinate of the screen’s left edge. The ball 'hit' the right edge of the screen if its x coordinate exceeds the x coordinate of the screen’s right edge.
If the ball 'hits' the edge of the screen, change the direction of the ball by changing its speed. If it hits the right or left edge of the screen, its x velocity should be negated. If it hits the top or bottom edge of the screen, its y velocity should be negated.

Pong
One of the first successful video games was Pong. Back in the 1970's, Pong was so complicated that devices were sold that played only Pong. Today, you know enough programming to create your own Pong game.
Details
Pong was designed to be like table tennis (get it? Pong, like ping-pong). Create a Python program that uses the graphics module to play a one-player version of Pong, like a person playing ping-pong against a wall.
The movement of the ball is just like the bouncing ball from the screen saver activity. Begin this program by copying that program and modifying it to include the paddle at the bottom of the screen. The paddle should follow the position of the mouse but only move horizontally.
Once the program has a paddle, finish the program by replacing the code that bounces the ball off the bottom of the window to be code that bounces the ball only if it hits the paddle.
Example
Hint
Use the mouse module’s
mouse.xfunction to get the location of the mouse.Use the mouse's x coordinate as the x coordinate when drawing the paddle. Use a fixed value, near the bottom of the screen, for the paddle's y coordinate.
Part of the power of writing code using functions is that it makes it easy to move it from one program to another. Testing if the ball hits the paddle is simple if you use a previously written function. The
rectangle_overlapsfunction or theis_point_in_rectanglefunction can test if the ball hits the paddle.If the ball does hit the paddle, its speed should change just like it hit the bottom of the screen.
The ball will bounce inside of the paddle if the paddle hits the side of the ball. To prevent this, only consider the ball hitting the paddle if the ball is also moving downward.
Challenge 1
When the ball goes off the bottom of the screen, the game is over. Inform the user by drawing the text "Game Over" and ending the animation loop.
Challenge 2
Modify the program so that it keeps score. Every time the ball bounces off the paddle, the score goes up. Draw score using the graphics.draw_text function.
Challenge 3
The game is kind of easy because the path of the ball is entirely deterministic. Make the game more interesting by speeding up the ball every time it bounces. Also, change the bounce angle based on where the ball hits the paddle.
Forward
The forward function we previously wrote made navigating the maze easier, but it didn’t always work great. Due to irregularities in the physics simulation, the distance the robotic car moves forward can vary. Repeatedly moving forward can compound this error and cause it to drift and eventually run into walls. We can fix this by using the robot car’s distance sensor to control the movement.
Details
Create a Python program that defines the function forward(distance: float) -> None that moves the car forward the specified distance. The function should assume the car is not moving when the function is called, and it should stop the car after it has moved the specified distance.
Example
import robotics

def forward(distance: float) -> None:
    # Put your code here.

def main() -> None:
    box_size: float
    box_size = 100.0 / 15.0
    robotics.add_ground()
    robotics.add_car()
    robotics.add_box(0.0, box_size * 0.5, box_size * -2.0, box_size, box_size, box_size)
    robotics.wait(1000)
    forward(box_size)
    return None

main()
Hint
Use the
robotics.get_car_distancefunction to get the distance between the car and the nearest object in front of it.Begin by moving the car slowly forward.
Use a
whileloop that repeatedly calls therobotics.waitfunction to continue to move forward.The loop should stop when the robot has moved the specified distance.
After the loop ends, set the car’s speed so that it stops moving forward.
Follow
People tend to anthropomorphize their robot’s behavior because it provides a familiar way to talk about the behavior that emerges from the programs we write. Writing a robotic car program to maintain a distance from a wall will create an emergent behavior of following the wall.
Details
Create a Python program where the robotic car follows a wall to its right. The car should modulate its speed such that it maintains a constant distance to the wall on its right.
Example
Hint
Use a loop that repeatedly calls the
robotics.set_car_speedand therobotics.waitfunctions.Use the
robotics.get_car_distancefunction to get the distance between the car and the nearest object to the right of it.If the car is farther than the desired distance to the right wall, the car should turn slightly right.
If the car is closer than the desired distance to the right wall, the car should turn slightly left.
Right-hand Rule
If you ever find yourself in a labyrinth, you can find your way out by following the right-hand rule. You put your hand on the wall to your right and walk forward so that your hand never stops touching the wall. This way, every time you come to an intersection, you will make a right turn. If you come to a dead-end, you will turn around. It may not be the most efficient way out of the maze, but as long as there are no loops in the maze, you will eventually make it out.
Details
Create a Python program where the robotic car uses the right-hand rule to traverse a maze. The car should always make right turns, follow walls to go straight if it can’t turn right, and turn left if it can’t go straight.
Example
Hint
Begin by copying your wall-following code and your maze creation code into a single program.
Add a condition that checks if there is a wall in front of the car. If there is, turn the car left 90 degrees. You can use the
leftfunction that you previously wrote to do this.Add another condition that checks if there is no wall to the right of the car. If these is not, then turn the car to the right.
Filter
The scatter plots of The National Longitudinal Study of Adolescent to Adult Health that we have produced have lots of seemingly errant data. For example, when plotting column 3, school grade, most of the numbers are in the range 7 to 12, since most adolescents are in grades 7 through 12. But some of the values in column 3 are 96 through 99. These numbers encode other responses like "refused", "legitimate skip (not in school)", "don’t know", and "school doesn’t have grade levels of this kind or not applicable". The problem is that when we plot column 3, we are treating all inputs as if they mean the same thing when they clearly do not. One simple way to solve this is to filter out the errant responses.
Details
Create a Python program that defines the function plot_filtered(col1: int, min1: float, max1: float, col2: int, min2: float, max2: float) -> None that plots two filtered columns of a spreadsheet. For each row in the spreadsheet, draw a point only if the x and y values are within the specified ranges. A point’s x-coordinate is col1 value and y-coordinate is the col2 value. The x-range is between min1 and max2, and the y-range is between min2 and max2.
Example
import spreadsheet
import plot

def main() -> None:
    spreadsheet.load("https://www.humblepython.com/static/editor/data/AddHealthWaveI.csv")
    plot_filtered(1, 11.0, 21.0, 3, 7.0, 12.0)
    return None

main()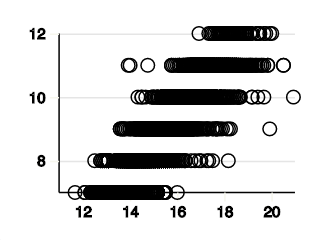
Hint
The function is very similar to the
plot_bivariatefunction that you previously wrote. Begin by copying that function and modify it to add the filter.To filter rows, add an
ifstatement that checks the current row’s x and y values.The
plot.draw_pointfunction should only be called if both the x and y values are in the correct ranges.
Frequency
All of the columns in The National Longitudinal Study of Adolescent to Adult Health are numeric. Yet, many of the columns actually represent categories. For example, column 2 is the respondent’s biological sex and only has two different values, 1 (male) and 2 (female). By treating this column as categorical data, we can produce analyses of the frequency of different categories.
Details
Create a Python program that defines the function compute_frequency(col1: int, min1: float, max1: float, col2: int, min2: float, max2: float) -> int that returns the number of rows that have a value in column col1 that is in the range [min1, max1] and a value in column col2 that is in the range [min2, max2].
Test
import spreadsheet

def compute_frequency(col1: int, min1: float, max1: float, col2: int, min2: float, max2: float) -> int:
    # Put your code here.

def main() -> None:
    spreadsheet.load("https://www.humblepython.com/static/editor/data/AddHealthWaveI.csv")
    test.equal(compute_frequency(2, 1.0, 1.0, 4, 1.0, 2.0), 2022)
    return None

main()
Hint
Use a for loop to iterate over all rows in the spreadsheet.
In the loop body, use an
ifstatement to check whether the col1 and col2 values are in the specified ranges.If they are, increment an accumulator variable.
Percentage
Looking at the frequencies of different categories is useful. Still, it is challenging to compare categories because they have different sizes. For example, the number of females who feel socially accepted is higher than that of males who feel socially accepted. But there are also more females than males. So instead of comparing frequencies, we want to compare percentages.
Details
Create a Python program that computes the percentage of males and females that feel socially accepted using the Add Health dataset. The column BIO_SEX is the respondants’ gender where 1 is male and 2 is femail. The column H1PF35 is the response to the prompt “You feel socially accepted.” with the following response encodings:
| 1 | strongly agree |
| 2 | agree |
| 3 | neither agree nor disagree |
| 4 | disagree |
| 5 | strongly disagree |
| 6 | refused |
| 8 | don’t know |
Consider either “strongly agree” or “agree” to mean socially feeling accepted.
Example
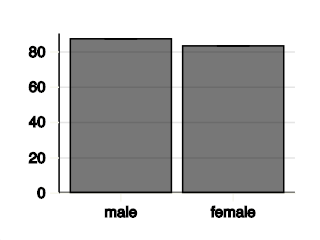
The percentage of males that feel socially accepted is 87%.
The percentage of females that feel socially accepted is 83%.
Hint
- Use the
compute_frequencyfunction you wrote to compute the number of males and females that feel socially accepted. - You can also use the
compute_frequencyfunction to compute the total number of males and females. - Compute the fraction that feels socially accepted by dividing the number that feels socially accepted by the total number.
- Compute the percentage by multiplying the fraction by 100.
- You can convert the percentage to a whole number by using the built-in
roundfunction.
Challenge
People often understand the relationship between numbers if they are visualized. Categorical data is typically visualized using a bar chart. Use the plot.add_bar function to create a bar chart that visualizes the percentage of males and females that feel socially accepted in the Add Health dataset.