Animate
Creating an animation on a computer screen is similar to the way that flipbook animations work. In a flipbook, you draw your image in one location. On the following page, you draw your picture in a new, updated place. Repeat until your animation is complete.
Details
Create a Python program that uses the graphics module to animate a circle moving horizontally across the screen. The circle should start on the left side of the screen and finish on the right side without going off.
Example
Hint
- Use a
forloop to repeatedly draw the image at a different location. Each iteration of the loop should draw the image slightly to the right of the previous location. - You can use the loop variable or an accumulator variable for the x-coordinate of the image.
- Don’t forget to clear the screen before you draw the image, or it will leave a trail.
- Don’t forget to wait after drawing the image, or the animation will happen too quickly.
Orrery
An Orrery is a mechanical model of the solar system that was first made in the 1700s. Mimicking the motion created with an orrery requires using some trigonometry to compute the new x and y positions.
Details
Create a Python that uses the graphics module to animate a planet orbiting around a star in the screen center. To compute the planet’s position, use the following equations to convert an angle, in radians, to the x and y coordinates of a point on a circle centered on the origin:
\( x = radius \cdot math.cos(radians)\)
\(y = radius \cdot math.sin(radians)\)
Example
Hint
- Use a
forloop to repeatedly draw a circle at a different location. - You can use the loop variable or an accumulator variable for the angle or rotation of the planet.
- Convert the angle to x and y coordinates using the math module’s
math.cosandmath.sinfunctions. - The math module’s trigonometric functions expect input in radians instead of degrees, so the angle should change by a small amount each iteration.
- Don't forget to import the math module.
- Don't forget to
clearthe screen andwaitto slow the animation.
Challenge
A real orrery doesn't just have one planet. It usually has many worlds, all orbiting at different distances and speeds. Modify your program to animate at least 2 separate planets at different radii and at different speeds.
Accelerate
Despite using a physics simulation, the robot car’s set_car_speed function doesn’t obey the laws of physics. It can instantly spin the car’s wheels at a significant speed, producing strange simulation effects. We can fix this by adding our own acceleration, which slowly increases the car’s speed.
Details
Create a Python program that uses the robotics module to accelerate the car to high speed. The vehicle should be able to reach a high speed without any wheels leaving the ground.
Example
Hint
- Accelerate the car by repeatedly setting the car’s speed inside of a loop.
- Use the loop variable to set the speed to larger values each iteration of the loop.
- Don’t forget to use the
waitfunction each iteration, or the acceleration will happen too quickly.
Crash
One of the great things about using a robotics simulation is that we don’t have to worry about damaging any expensive components. In fact, we can purposefully put the car in harrowing situations.
Details
Create a Python program that uses the robotics module to crash the car into a wall of boxes. The boxes should be arranged in a grid and have mass so that they can be knocked over.
Example
Hint
- Use a
forloop to create a row of boxes. - You can use the loop variable or an accumulator variable for the x-coordinate of the boxes.
- Put the loop that creates a row of boxes into another loop to create a grid of boxes.
- You can use the outer loop’s variable or an accumulator variable for y-coordinate of the boxes.
Challenge
Add a ramp to create a more dramatic collision.
Plot
The datasets we work with are often enormous, so it can be useful to visualize the data before performing any analysis. Plotting the values in a column can give you an idea of whether the data is clustered or evenly distributed.
Details
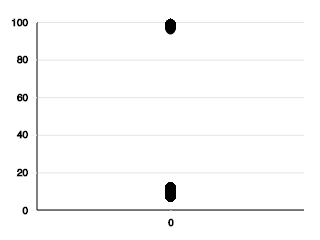
Create a Python program that uses the spreadsheet module to plot the data in a CSV file column. The program should prompt the user for the index of a column and display a plot of all of the values.
Example
AID: 0
AGE: 1
BIO_SEX: 2
H1GI20: 3
H1PF35: 4
Enter the column index:
3
Hint
- Use a loop to repeatedly get a value from the spreadsheet and plot the value.
- Use the loop variable to get a different value from the spreadsheet each iteration of the loop.
Mean and Standard Deviation
The datasets we work with are often enormous, so it can be useful to compare the data’s summative properties. Two Typical and valuable properties are the mean and standard deviation. The mean describes the average value, while the standard deviation describes the density of the data.
Details
Create a Python program that uses the spreadsheet module to summarize the data in a column of a CSV file. The program should prompt the user for the index of a column and should print the mean and the standard deviation of the numbers in the column. The following equations define the mean and standard devation:
\(mean = \frac{\sum_{i=1}^{n} x_i}{n}\)
\(std = \sqrt{\frac{\sum_{i=1}^{n} (x_i - mean)^{2}}{n - 1}} \)
The value xi is the ith value in a column, and n is the number of values in a column.
The example below uses subset of the The National Longitudinal Study of Adolescent to Adult Health (Add Health) dataset. You can test your program using that CSV file to ensure it works correctly, but if there is a problem with your program, it is difficult to debug it when the input file contains thousands of rows. So before testing your program on the Add Health dataset, try it on the elementary CSV file with just a few rows that you created.
Example
AID: 0
AGE: 1
BIO_SEX: 2
H1GI20: 3
H1PF35: 4
Enter the column index:
3
mean: 10.96857556336572
std: 12.70104838848311
Hint
- To you compute the mean of a column, you will need to calculate the sum of all the values in the column.
- To compute the total of the values, you will need to use a loop with an accumulator variable.
- Each iteration of the loop, should update the accumulator variable by adding a value from a row of the CSV.
- Use the loop variable to get a different value from the spreadsheet each iteration of the loop.
- To compute the standard deviation, you will first need to calculate the mean.
- Use a second
forloop with a second accumulator to calculate the sum in the standard deviation equation.
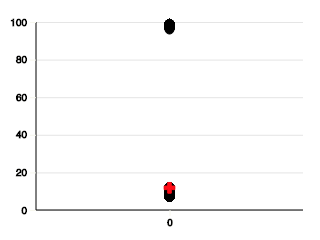
Challenge
Plot the mean on top using a different symbol and color: