- Location
- Trexler 363
- Times
- T/TH 10:10 - 11:40 AM
- Office Hours
- M-Th 6 - 7pm
- Office
- Trexler 365B
- chssmith AT roanoke DOT edu
Lab 4: Turtle and For Loop Finale
We have been covering for loops, turtle, and functions for a week now. Today is our last day of focusing on just these topics. On Tuesday, we will move on. It is very important that the structure of these makes sense to you. So, if by the end of the day you still feel like you don't understand these structures, please let me know ASAP.
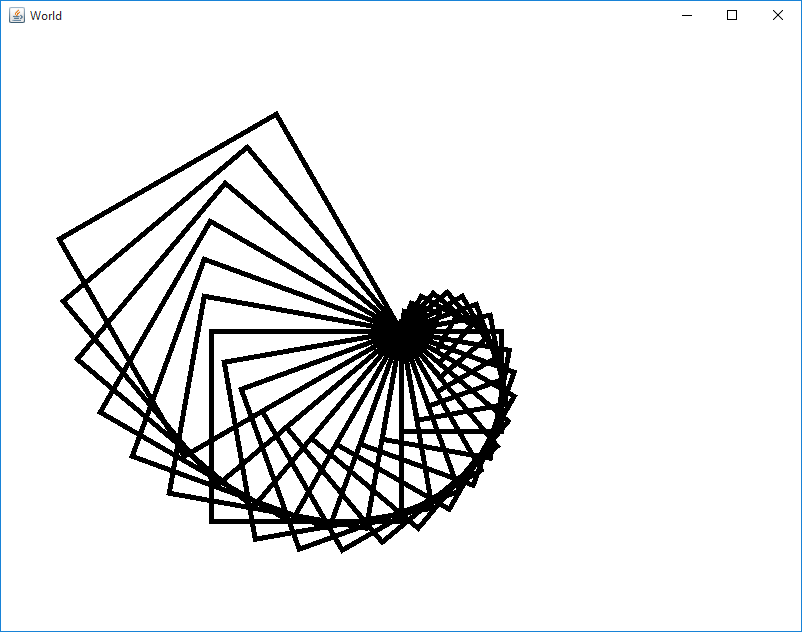
Nautilus
In a file called Nautilus.py, write a program that draws a series of overlapping squares. These squares should all begin at the same spot (the center of the window). However, each subsequent square should be slightly larger than the previously drawn square. In addition, each subsequent square should be drawn slightly askew from the previous square, to achieve a sea-shell like appearance.
Hint
First, create a function called draw_square(side_length,
angle). This function takes two integers as parameters:
the length of a side of the square, and the angle
that the turtle should start at when drawing the square. Recall
that you can use the setHeading(angle) function of
the turtles to automatically turn the turtle to a specified angle.
Once you the draw_square function written, try using this to draw two overlapping squares at the center of the turtle window. This is to just check and make sure that the draw_square function works.
Afterwards, create a function
called draw_nautilus(num_squares, offset), which takes
two integer parameters: the number of squares to draw in the
sea-shell, and an offset. This offset can be used to both
increase the side length of a square, and the heading of the
turtle.
draw_nautilus should use a for loop to call draw_square several times. You should use the offset and loop variables in your computations for the parameters to the draw square function. This will assure that each loop iteration, your new squares would be drawn larger at increasing angles.
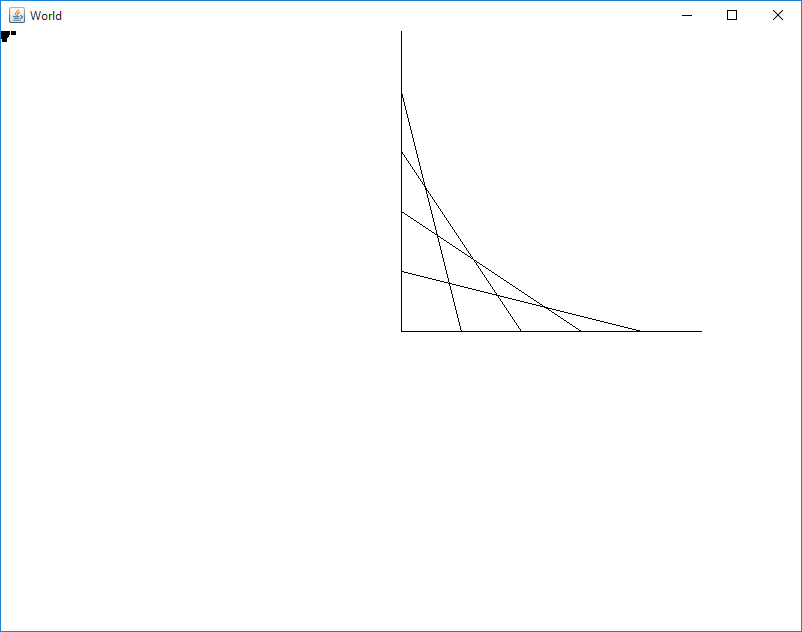
Curve
In a file called Curve.py, write a program that draws a series of straight lines to approximate a curve. Consider the following lines.
A curve of this type can be drawn by connecting points that are some distance along line #1, to a point that is the same distance along line #2, as seen in the following picture:
If you draw enough of these lines, you can approximate what is known as a Bezier curve, which is a very well known and studied construct in computer graphics.
Hint
This activity is going to make extensive use of
the moveTo function we discussed earlier. Make
sure you fully understand how this function works before moving on.
The most important part of this activity is keeping track of where your turtle, and lines are in the coordinate system of the turtle world. Remember (0, 0) is the upper left hand corner of the turtle window.
Draw two lines perpendicular (at a 90° angle to one another) on the center of the screen. After drawing these lines, you should be able to define the points (x1, y1), (x2, y2) , and (x3, y3). Let (x1, y1) be the top most point, (x2, y2) be the point of intersection, and (x3, y3) be the point at the other end of the horizontal line.
Define a variable called number_of_lines, and store an integer which is the number of lines you want to draw in the curve. You can get how far from the end points (offset) you need to move for each line segment by dividing the length of the main lines by this variable.
Given this offset, you need to compute 4 new values: (x4, y4) and (x5, y5). (x4, y4) should be on your vertical line, so x4 should be the x coordinate of the vertical line. The y coordinate should be the top most points's y value (y1) plus the offset. (x4, y4) should be on the opposite (horizontal) line, so y4 should be the y coordinate of that line. x4 should be the corner x coordinate (x2) plus the offset. You then just connect these points.
Using a loop, you can iterate how many offsets are used in drawing these points. This loop should execute number_of_lines times.