- Location
- Trexler 363
- Times
- MWF 10:50 - 12:50
- Office Hours
- M-Th 6 - 7pm
- Office
- Trexler 365B
- chssmith AT roanoke DOT edu
Lab 8: Modules
As usual, create a directory to hold today's files. All programs that you write today should be stored in this directory.
$ cd ~/cs120/labs
$ mkdir lab8
$ cd lab8
Write a Python program that will print the result of rolling 12 six sided dice to the terminal window.
Example Output
$ python3 practice1.py
2
1
4
3
2
6
5
4
1
2
1
1
Write a Python program that can compute the number of pairs that can
be created from our CPSC 120 class. You should use
the input function to determine how many students are
in your class.
The number of combinations of size k that can be created from a set of size n can be computed using the binomial equation:
\[ \binom nk = \frac{n!}{k! \cdot (n - k)!} \]Example
$ python3 practice2.py
How many students are in your class? 20
There are 190 pairs.
Hopefully you are familiar with the sine and cosine functions from back in your trigonometry class. As you can imagine, these are incredibly useful functions not only for mathematics, but for drawing in general.
Details
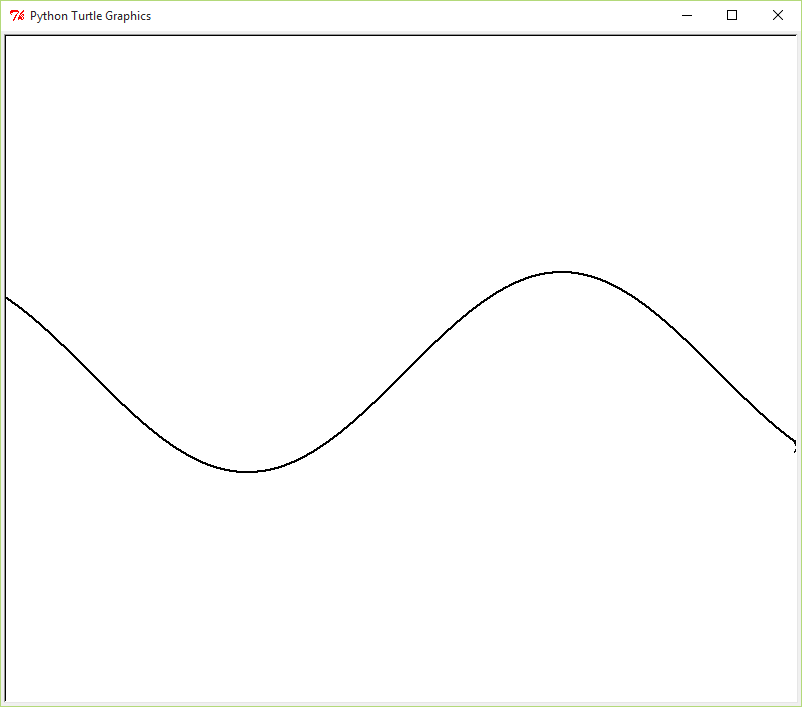
In Emacs, create a Python program in a file called sine.py
that uses the turtle module to draw a function plot of
the math.sin function. The program should prompt the
user for the amplitude of the sin function, in turtle window units.
Test your program by running it multiple times with different input values. Make sure your code follows the courses code conventions.
Example
$ python3 sine.py
Enter the amplitude: 100

Hint
- You are going to approximate the sine wave curve by simply sampling the sine function. You are going to choose a set of equally spaced points on the curve. Use a for loop that starts at the left part of the window, and increases the value by a fixed step until it gets to the right portion of the window.
-
Treat the input to the
math.sinfunction as the x coordinate of the point on the turtle window, and the return value as the y coordinate. You then simply have togotoeach one of these points in a sequence. -
The
math.sinfunction always returns a value between -1 and 1. You need to use the amplitude to increase the size of this output, so you can visually see the actual sine wave. You can do this by multiplying the output byamplitude. -
To smooth the sine wave out, divide the input to
the
math.sinby the amplitude as well.
Challenge
The sine and cosine functions are interesting, but I think the tangent function is a much more visually appealing function. Change the color of the turtle's pen, and also plot the tangent function on top of the sine function.
In old CRT monitors if the same image was displayed for too long, a ghost of the image would get 'burned' into the screen. To prevent this from occuring a screensaver would run whenever the computer was inactive for a period. Modern LCD monitors no longer need screen savers, but they can still be fun to watch.
Details
In Emacs, create a Python program in a file called screen_saver.py that uses the turtle module to draw many dots on the screen. The dots should be in random locations, centers located anywhere in the window, have random sizes, in the range [100, 300], and should be random colors.
-
Use the
turtle.dotfunction to draw the dots. -
Use the
turtle.pencolorfunction to change the color of the dots. -
Use the
window_widthandwindow_heightfunctions to determine the width and height of the window.
Make sure your code follows the courses code conventions.
Example
$ python3 screen_saver.py

Hint
-
Use a for loop to repeatedly draw dots to the screen
using the
turtle.dotfunction. -
Use the
random.randrangefunction to generate random numbers in the range [100, 300]. Remember thestopargument is exclusive. -
The
turtle.pencolorfunction takes three numbers, one each for red, blue, and green, to specify a color. To generate a random color, you will need to generate three random numbers. - The point (0, 0) is in the center of the window. So the largest x value is the half of the window width and the largest y value is half of the window height. What are the smallest x and y values?
Challenge
The random dots screen saver is good, but is pretty silly.
Instead, you already have a program written that can draw polygons
with an arbitrary number of sides. Write a new program
called screen_saver_poly.py, which generates a large
number of polygons with a random number of sides in the range
\([3, 20]\). These shapes should also be filled in a random color.