- Location
- Trexler 363
- Times
- MWF 10:50 - 12:50
- Office Hours
- M-Th 6 - 7pm
- Office
- Trexler 365B
- chssmith AT roanoke DOT edu
Assignment 3
This is a pair assignment. You should create a directory called assignment3 in cs120/assignments for this assignment. All code written for this assignment should be stored in that directory.
$ cd ~/cs120/assignments
$ mkdir assignment3
$ cd assignment3
Riemann Sums
 Given an arbitrary mathematical function, being able to estimate the
area under the curve generated is a really important skill to have.
In Physics, this value can tell you a lot about the motion of some
projectile. In Chemistry, they can be used to define kinetics for
enzymes. They even have use in Accounting, where they can be used
to calculate compounded interest on loans. In this assignment, you
will write a program that uses the Riemann Sum approximation of the
area under a curve.
Given an arbitrary mathematical function, being able to estimate the
area under the curve generated is a really important skill to have.
In Physics, this value can tell you a lot about the motion of some
projectile. In Chemistry, they can be used to define kinetics for
enzymes. They even have use in Accounting, where they can be used
to calculate compounded interest on loans. In this assignment, you
will write a program that uses the Riemann Sum approximation of the
area under a curve.
Details
Using the Turtle module, you are going to write a
program that can plot an arbitrary polynomial. To accomplish this,
you should define a function called polynomial(x),
which takes a floating point value x, and returns the result of
calculating the value of the polynomial with the value of x. You
should define some polynomial inside of this function. As a
starter, use the following polynomial:
$$f(x) = x ^ 3 - 2 \cdot x ^ 2 + 6 \cdot x + 5$$
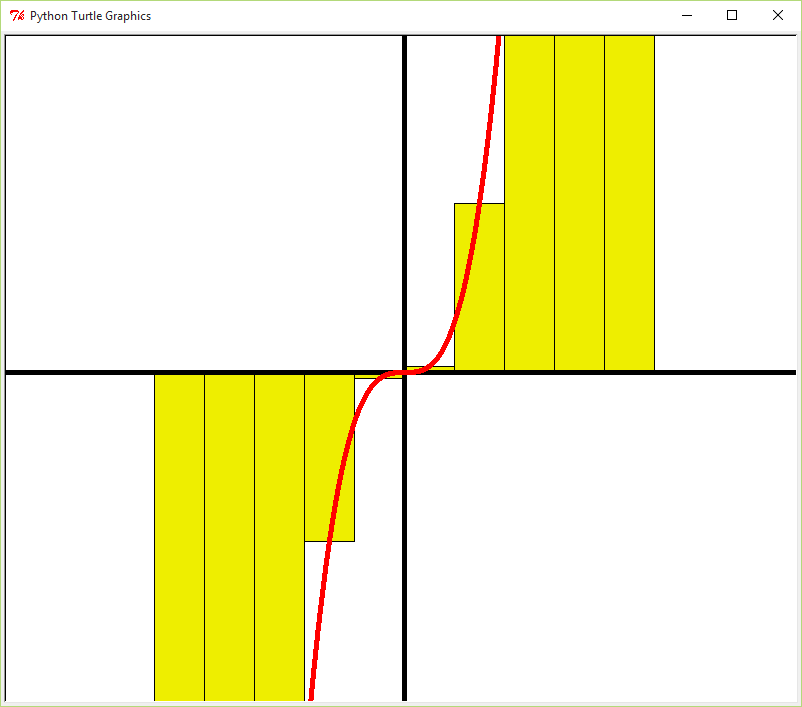
Using the defined function above, plot the polynomial on the turtle window. In order to make the plotted function easier to view, you should scale the output of your function up, similar to what we did for the sine function activity.
Once you have plotted the function, you are going to then compute
and plot a series of rectangles to estimate the area under the curve
for some range of values from the domain of the previously defined
polynomial. Define a function called estimate_area(start,
end, size), which takes integers for the starting x
value of the range, the ending x value of the range, and
the width of the rectangle used to estimate the area under the
curve.
This function should compute a series of rectangles of the size specified, with a height determined by the value of the polynomial at one of the points specified in that range. Your estimate of area under the curve is just the sum of the area of all of the rectangles combined. Print the estimated value of the area, and draw the rectangles you computed on the turtle window as well.
"Hacker" Prompt
Each week, additional exercises related to the assignment will be provided at the end. These exercises are typically more challenging than the regular assignment. Bonus points will be provided to students who complete any of the "Hacker" level assignments.
-
Even Better Estimates: You likely assumed that the value you computed from the polynomial was one of the corners of the rectangle. This provides a decent estimate, but ultimately will always be an over (or under, depending on which corner, etc) estimate of what the value really is. Alter your program so that shifts where you compute the height of the rectangle so that you use the center of the rectangle.
-
Convergence: The area under the curve can be computed by taking the integral of the polynomial. This can be best approximated by computing the area where the size of the rectangles approaches 0. While this is "impossible" for you to currently compute in python, we can compute how much the integral changes as we decrease the width of the rectangles. Use a for loop to compute and print a table of ever decreasing widths of rectangles, and their associated estimate of the area.
-
Square Roots: There are some functions that we can plot, but have some issues that cause Python to not be able to compute values for an area under a curve. For example, \(\sqrt{x}\) cannot be computed, because you cannot compute the square root of negative values, and the fact that it is not, technically, a function (\(\pm y = \sqrt{x}\)). Create a second program that allows you to plot the square root function.
Grading
The assignment will be graded on the following requirements according to the course’s programming assignment rubric.
Functionality (75%): A functional program will:
-
Have at least two functions,
estimate_areaandpolynomial -
Plot the
polynomialto the turtle window. -
Scale the drawing of the
polynomialfunction based on the value of some defined constant variable. -
Use Riemann Sums to estimate and print the area under the curve
for some region of the function defined in
polynomial. - Draw the rectangles used to estimate the area to the turtle window.
Style (25%): A program with good style will:
- include a header comment signifying the authors of the file,
- avoid magic numbers (literal primitive numbers),
- use meaningful names for variables and functions,
- have statements that are small (80 characters or less including leading space) and do one thing, and
- have functions that are small (40 lines or less including comments) and do one thing
- have a comment above functions that includes the purpose, the pre-conditions, and the post-conditions of the function.
- have spaces after commas in argument lists and spaces on both sides of binary operators (=, +, -, *, etc.).
Creative: Drawing
Using functions it is possible to create more complex drawings without a lot more code. If a function is written to be flexible or abstract it can be used to draw multiple different elements.
Details
Create a Python program that uses the turtle module to draw a picture. The picture can be anything you want, but must:
- not be derivative of previous work.
- have a function that draws something. The function must:
- have multiple parameters that change what is drawn.
- be called repeatedly as a component of a more complex drawing.
Extra
Superb drawings will receive extra credit. I will be the arbiter of whether a drawing is astounding.
Grading
The assignment will be graded on the following requirements according to the course’s programming assignment rubric.
Effort (40%): Here are example drawings with average effort:


Functionality (35%): A functional program will:
- not be derivative of previous work.
- have a function that draws something.
- the function must have multiple parameters that change what is drawn.
- the function must be called repeatedly as a component of a more complex drawing.
Style (25%): A program with good style will:
- include a header comment signifying the authors of the file.
- avoid magic numbers (literal primitive numbers).
- use meaningful names for variables and functions.
- have statements that are small (80 characters or less including leading space) and do one thing.
- have functions that are small (40 lines or less including comments) and do one thing.
- have a comment above functions that includes the purpose, the pre-conditions, and the post-conditions of the function.
- have spaces after commas in argument lists and spaces on both sides of binary operators (=, +, -, *, etc.).
Your program should include the traditional header, use appropriate variable names, and nicely label all values printed to the terminal. Submission are to be done through inquire.roanoke.edu through the Assignment 2 link. Both partners must submit through cseval!